![The States That Drink the Most Wine in America (2023) [Map]](https://vinepair.com/wp-content/themes/vpcontent/images/blank.gif)
Despite the bleak forecast for much of the global wine industry, Americans still love their red, white, and rosé. In 2021, the U.S. imported a whopping 456 million gallons of wine, accounting for roughly 17 percent of the world’s total wine imports. And with the U.S. being home to over 11,000 wineries, American drinkers have no shortage of options when it comes to great bottles — and their consumption habits prove it. In 2021, Americans drank over 935 million gallons of wine, according to new data from the National Institute on Alcohol Abuse and Alcoholism (NIAAA).
When analyzed on a regional scale, the South drinks the most amount of wine in sheer volume, with just shy of 318 million gallons consumed there in 2021 alone. Conversely, Americans in the Midwest drank the least wine overall, consuming just 164 million gallons the same year. This region also consumed the least amount of wine per capita at 0.37 gallons per resident, while Americans on the West Coast — the region home to the most wineries in the U.S. — drank the most per capita at 0.54 gallons.
Curious to see how much wine was consumed in your home state? Check out our maps below to discover how much wine your state drinks by volume and per capita.
Don’t Miss A Drop
Get the latest in beer, wine, and cocktail culture sent straight to your inbox.
The States That Drink the Most Wine Per Capita
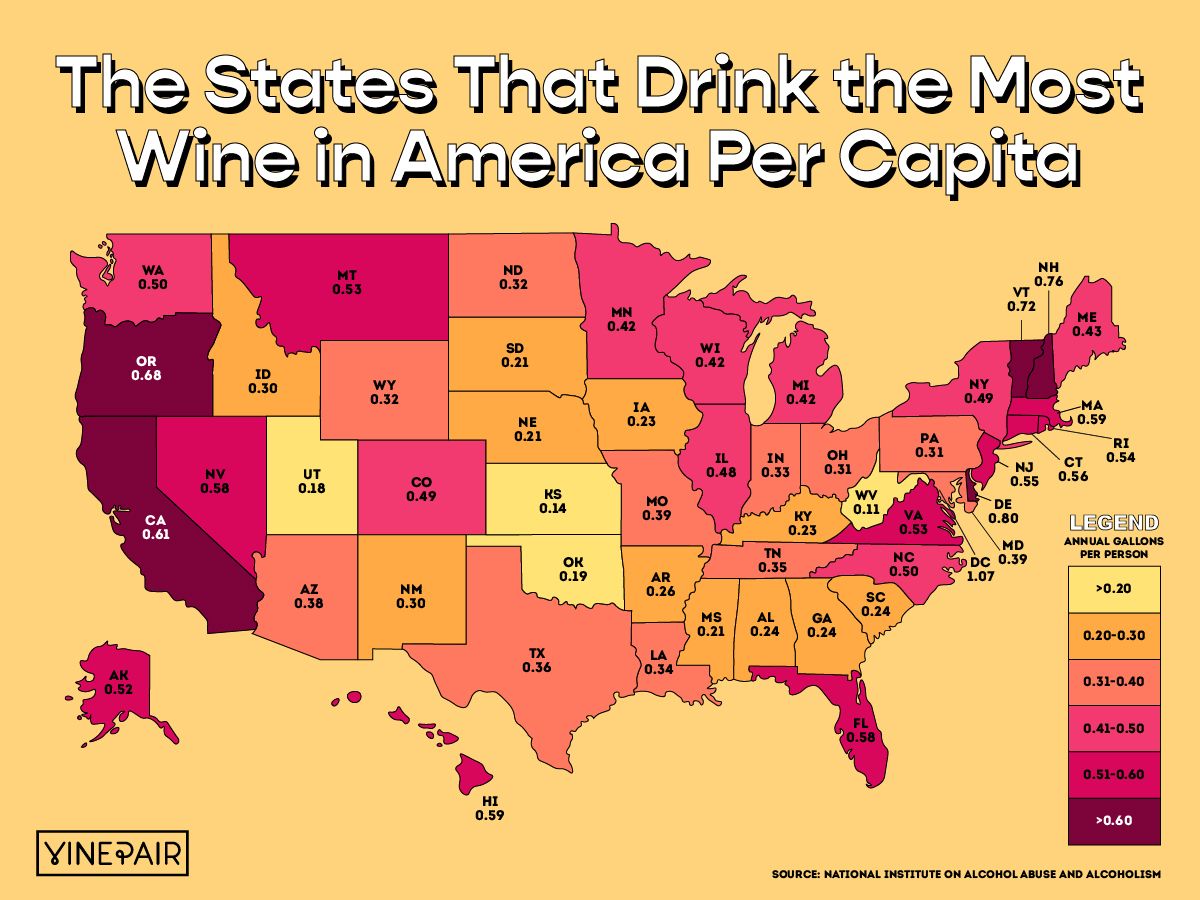
Americans in Washington, D.C., consumed the most wine per capita in 2021 at 1.07 gallons per person. Delaware and New Hampshire round out the top three with 0.8 gallons and 0.76 gallons per resident, respectively. Both states’ high placement is likely due to their lack of sales tax, driving neighboring states’ drinkers to cross the border to take advantage. On the other end of the spectrum, West Virginians drank the least amount of wine, consuming just 0.11 gallons per person.
The States That Drink the Most Wine Overall
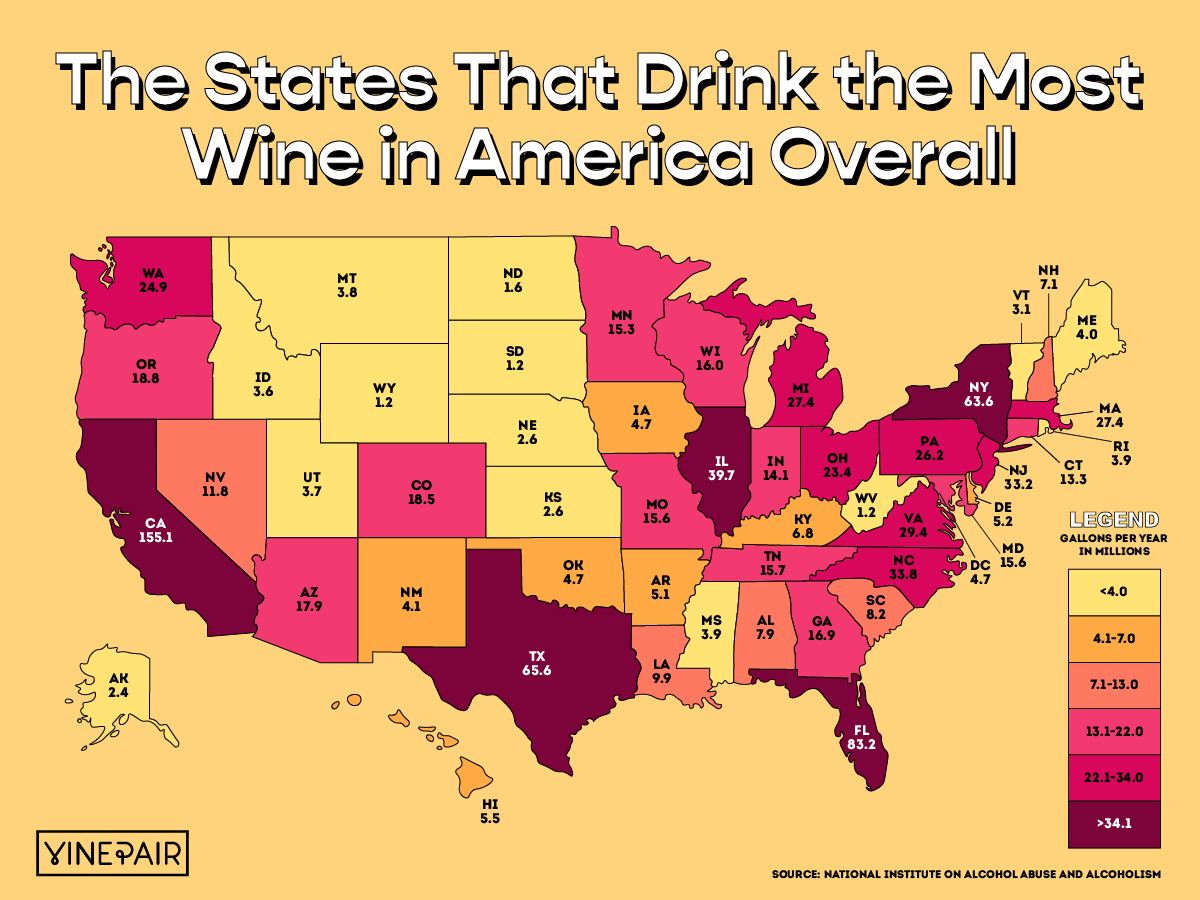
California, the state home to the highest population and the highest number of vineyards, naturally consumed the most wine in 2021: over 155 million gallons. In second place is Florida, having consumed 83.2 million gallons, and Texas takes third with 65.6 million gallons. On the opposite end of the scale, South Dakota, West Virginia, and Wyoming drink the least amount of wine overall, each sipping just 1.2 million gallons of the stuff that year.
Ranking the States
Gallons Per Capita
| Rank | State | Gallons of Ethanol Per Capita* |
|---|---|---|
| 1 | Washington D.C. | 1.07 |
| 2 | Delaware | 0.80 |
| 3 | New Hampshire | 0.76 |
| 4 | Vermont | 0.72 |
| 5 | Oregon | 0.68 |
| 6 | California | 0.61 |
| 7 | Hawaii | 0.59 |
| 8 | Massachusetts | 0.59 |
| 9 | Florida | 0.58 |
| 10 | Nevada | 0.58 |
| 11 | Connecticut | 0.56 |
| 12 | New Jersey | 0.55 |
| 13 | Rhode Island | 0.54 |
| 14 | Montana | 0.53 |
| 15 | Virginia | 0.53 |
| 16 | Alaska | 0.52 |
| 17 | North Carolina | 0.50 |
| 18 | Washington | 0.50 |
| 19 | Colorado | 0.49 |
| 20 | New York | 0.49 |
| 21 | Illinois | 0.48 |
| 22 | Maine | 0.43 |
| 23 | Michigan | 0.42 |
| 24 | Minnesota | 0.42 |
| 25 | Wisconsin | 0.42 |
| 26 | Maryland | 0.39 |
| 27 | Missouri | 0.39 |
| 28 | Arizona | 0.38 |
| 29 | Texas | 0.36 |
| 30 | Tennessee | 0.35 |
| 31 | Louisiana | 0.34 |
| 32 | Indiana | 0.33 |
| 33 | North Dakota | 0.32 |
| 34 | Wyoming | 0.32 |
| 35 | Ohio | 0.31 |
| 36 | Pennsylvania | 0.31 |
| 37 | Idaho | 0.30 |
| 38 | New Mexico | 0.30 |
| 39 | Arkansas | 0.26 |
| 40 | Alabama | 0.24 |
| 41 | Georgia | 0.24 |
| 42 | South Carolina | 0.24 |
| 43 | Iowa | 0.23 |
| 44 | Kentucky | 0.23 |
| 45 | Mississippi | 0.21 |
| 46 | Nebraska | 0.21 |
| 47 | South Dakota | 0.21 |
| 48 | Oklahoma | 0.19 |
| 49 | Utah | 0.18 |
| 50 | Kansas | 0.14 |
| 51 | West Virginia | 0.11 |
Gallons Overall
| Rank | State | Gallons Overall* |
|---|---|---|
| 1 | California | 155.1M |
| 2 | Florida | 83.2M |
| 3 | Texas | 65.6M |
| 4 | New York | 63.6M |
| 5 | Illinois | 39.7M |
| 6 | North Carolina | 33.8M |
| 7 | New Jersey | 33.2M |
| 8 | Virginia | 29.4M |
| 9 | Massachusetts | 27.4M |
| 10 | Michigan | 27.4M |
| 11 | Pennsylvania | 26.2M |
| 12 | Washington | 24.9M |
| 13 | Ohio | 23.4M |
| 14 | Oregon | 18.8M |
| 15 | Colorado | 18.5M |
| 16 | Arizona | 17.9M |
| 17 | Georgia | 16.9M |
| 18 | Wisconsin | 16.0M |
| 19 | Tennessee | 15.7M |
| 20 | Maryland | 15.6M |
| 21 | Missouri | 15.6M |
| 22 | Minnesota | 15.3M |
| 23 | Indiana | 14.1M |
| 24 | Connecticut | 13.3M |
| 25 | Nevada | 11.8M |
| 26 | Louisiana | 9.9M |
| 27 | South Carolina | 8.2M |
| 28 | Alabama | 7.9M |
| 29 | New Hampshire | 7.1M |
| 30 | Kentucky | 6.8M |
| 31 | Hawaii | 5.5M |
| 32 | Delaware | 5.2M |
| 33 | Arkansas | 5.1M |
| 34 | Washington D.C. | 4.7M |
| 35 | Iowa | 4.7M |
| 36 | Oklahoma | 4.7M |
| 37 | New Mexico | 4.1M |
| 38 | Maine | 4.0M |
| 39 | Mississippi | 3.9M |
| 40 | Rhode Island | 3.9M |
| 41 | Montana | 3.8M |
| 42 | Utah | 3.7M |
| 43 | Idaho | 3.6M |
| 44 | Vermont | 3.1M |
| 45 | Kansas | 2.6M |
| 46 | Nebraska | 2.6M |
| 47 | Alaska | 2.4M |
| 48 | North Dakota | 1.6M |
| 49 | South Dakota | 1.2M |
| 50 | West Virginia | 1.2M |
| 51 | Wyoming | 1.2M |
*This data uses an estimate of average ethanol content of sold or shipped spirits into gallons of ethanol (pure alcohol) before calculating per capita consumption estimates. For this data, the alcohol by volume value is 0.129 for wine, 0.045 for beer, and 0.411 for spirits.
*Image retrieved from Davide Angelini via stock.adobe.com